Every marketing function eventually faces the same question, just in different dialects. The Head of Consumer Insights gets it through tracker decks. The Head of Marketing Analytics gets it through an MMM rebuild. The CFO asks the sharpest version, usually with the bonus tied to the answer.
The question is always some version of: What did our brand spend produce last quarter, in dollars, and where did the growth actually come from?
In most analytics stacks, the answer arrives on a slower clock than the question deserves. Surveys come in quarterly. Marketing mix models reconcile in batches and aggregate across channels. Brand equity scores update once a year and live in slide decks rather than balance sheets. The work is being done. It's just being done on a clock that doesn't match the decisions waiting on it.
When 3G Capital ran zero-based budgeting at Kraft Heinz, this exact gap produced a $15.4 billion write-down three years later. The point isn't that one company got it wrong. The point is that the standard toolkit isn't built to flag erosion in time to act on it.
The question we started with
We founded eBrandValue in 2015 around a simple idea: if brand value were treated as a financial instrument, it could sit alongside price and distribution in the same operating dashboard.
In practice, that requires three things: daily resolution instead of quarterly reporting, dollar-denominated measurement instead of abstract equity scores, and decomposition into clear growth drivers. The result is that brand becomes measurable in the same economic terms as the rest of the business.
That changes the conversation materially. A CFO can evaluate whether the next marginal dollar should go toward brand, pricing, or distribution using comparable financial signals. A CMO can quantify their brand’s contribution to revenue without relying on proxy metrics or delayed survey waves.
For organizations still relying on quarterly brand tracking, the same directional signal becomes visible much earlier here — and reconciles directly against commercial outcomes. Instead of debating whether a campaign “worked,” teams can focus on where incremental investment is most likely to produce growth.
Why social, and why not for the reason you think
Social is the right signal for this measurement, but not because consumers post about brands.
It's because social engagement is continuous, observed, and structurally graded. The signal arrives constantly rather than quarterly. It captures what people actually do rather than what they report in a survey. And it carries direction and intensity that map cleanly onto a financial readout.
What that produces is a leading indicator with weekly resolution. Changes in brand engagement show up in the data before they show up in sales. By the time the quarterly report is in, the signal that predicted it has been visible for weeks. Acting on it earlier is the whole point.

Making the decomposition hold up
A brand ROI answer that holds up under finance review has to decompose. Revenue comes from six places: macro tailwinds and headwinds, competitive moves, communication and digital investment, distribution shifts, price actions, and brand strength.
The first five have been measurable in some form for years. The sixth — brand strength — has mostly lived as a survey number that arrives too late to act on, or as a brand equity score that doesn't reconcile against the income statement. Putting brand strength on the same measurement grade as the other five completes the picture.
When the decomposition runs this way, "where did our growth come from" stops being a debate. It becomes a calculation. Each driver has a coefficient, each coefficient has a confidence band, and the residual that used to absorb everything we couldn't explain becomes a measurable, defensible line item.
That's the level of resolution finance accepts and brand teams can defend in the same room.
A decade of production, not a decade of research
The methodology has a ten-year research lineage in marketing science and was independently validated this year with a third-place finish at the 2026 INFORMS Innovative Applications in Analytics Award, evaluated on analytical novelty, cross-industry applicability, and measurable economic impact. Past finalists include Ford, Alibaba, Verizon, and Janssen. The recognition was gratifying, but honestly, the application layer was the harder part. That's what took the decade.
The engine has run for a Fortune 500 client base since 2015, across financial services, beverages, consumer technology, payments, and media. One application I come back to often: a beverage company holding a challenger position in a competitive market used the platform over a ten-year window to invert a twenty-point market share gap and generate more than a billion dollars in incremental annual revenue. The decisions weren't all heroic. The value was in catching small signal shifts early and reallocating before competitors did.
On forecasting, the ensemble runs at about 24% MAPE on 12-to-24-month brand-level sales forecasts. Traditional marketing mix models typically land around 20% error at 3-to-6-month horizons. Similar accuracy, four to eight times further out.
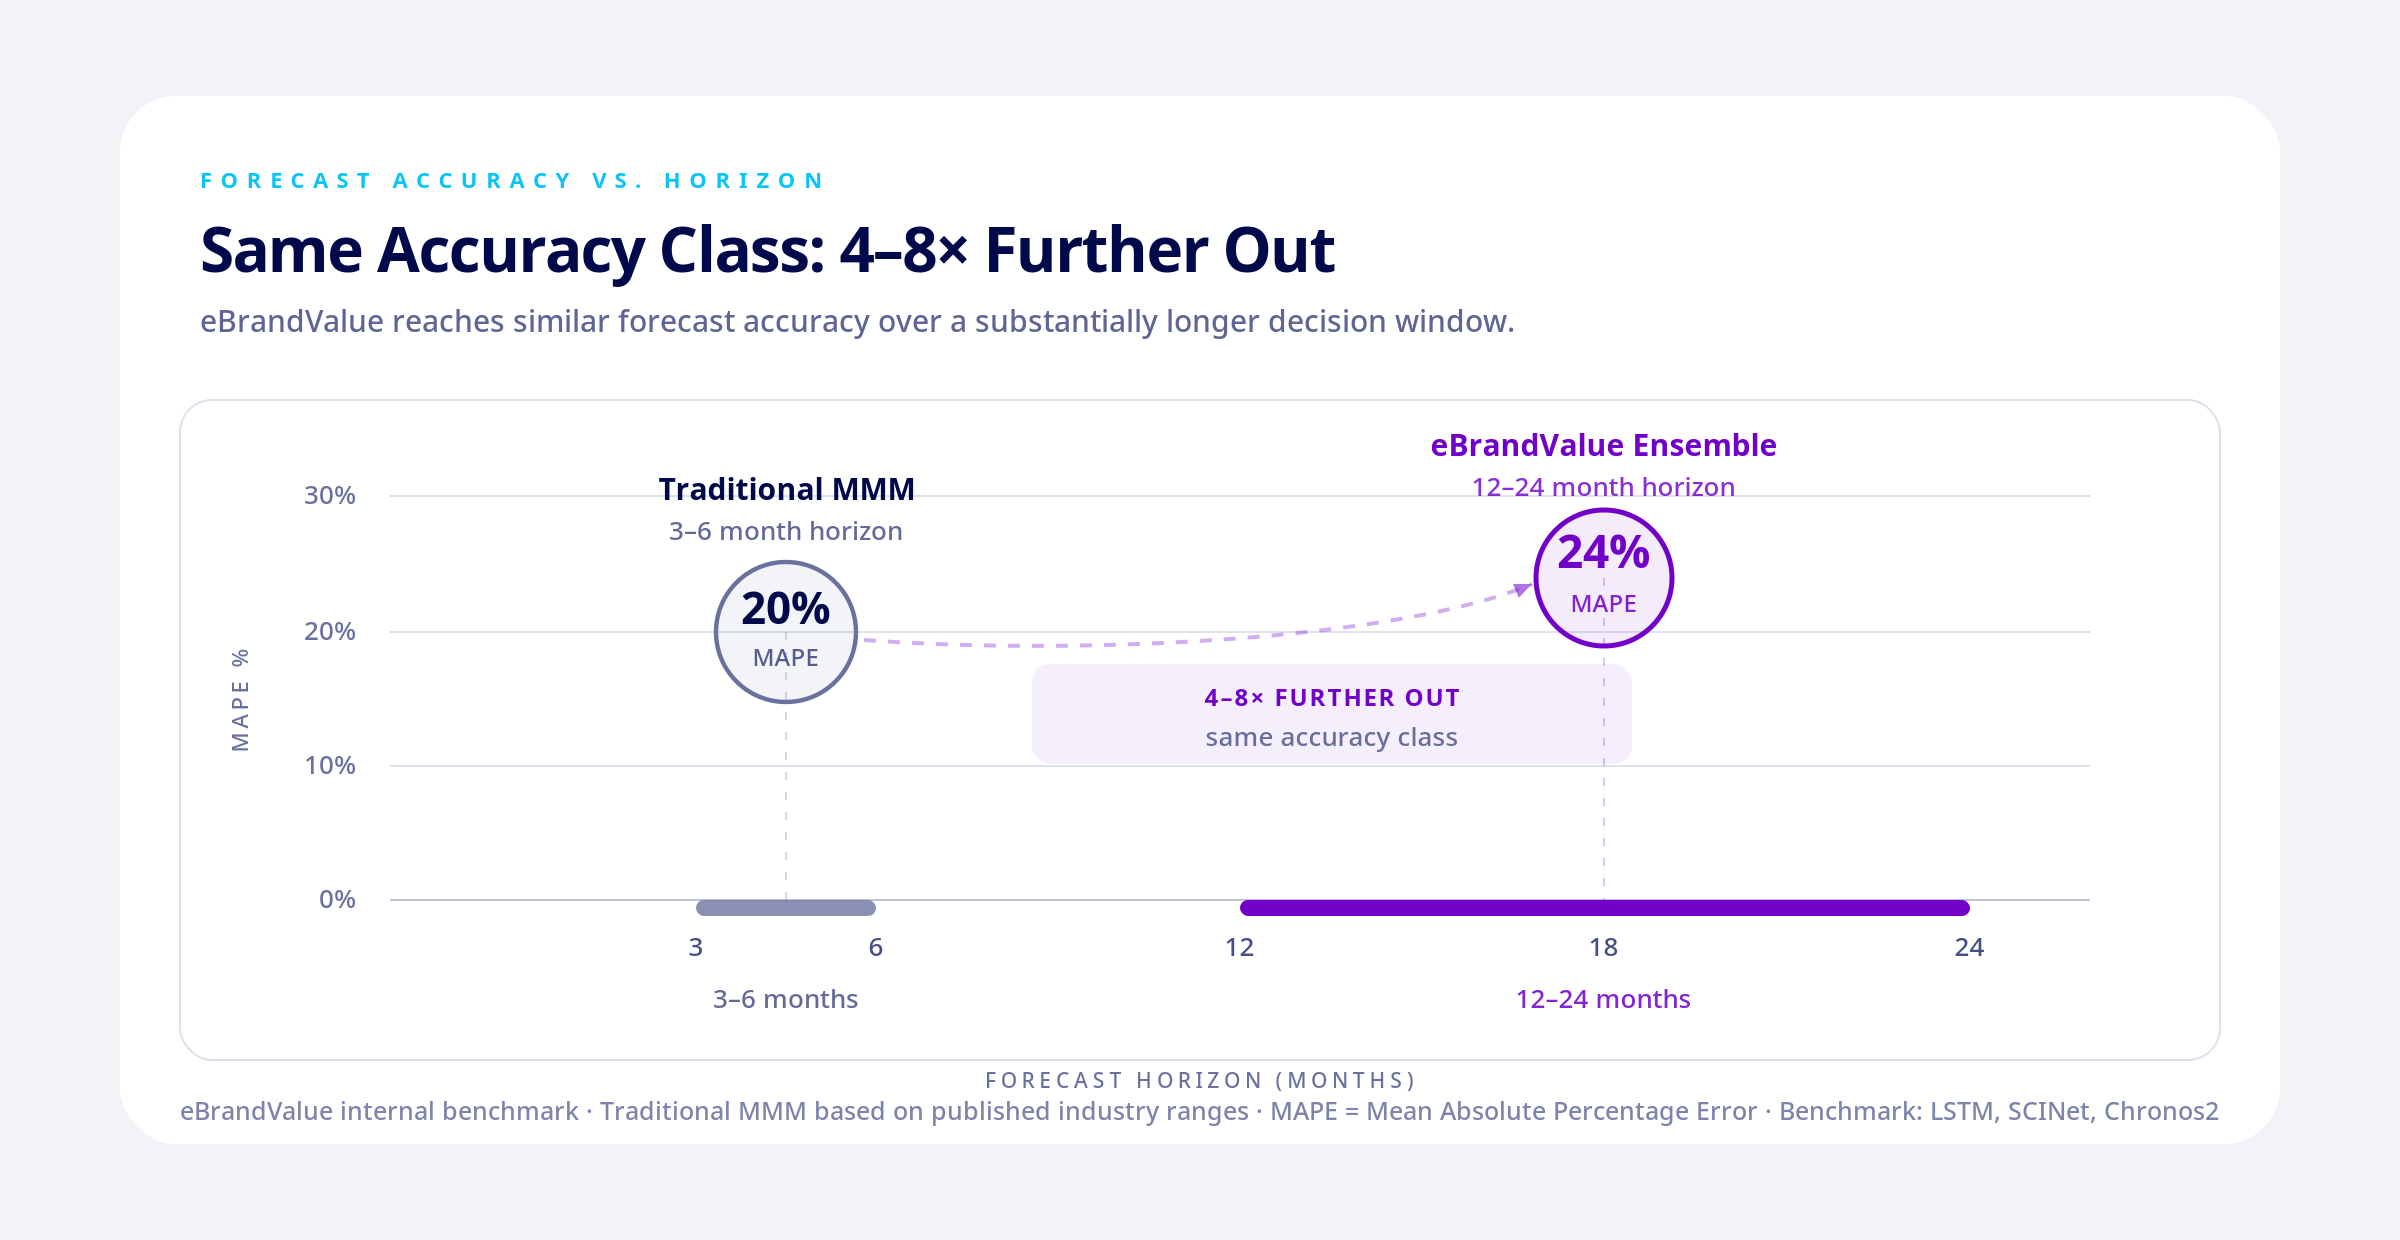
Benchmarking against standalone deep learning approaches — LSTM, SCINet, Chronos2 — produced a consistent finding: the model class isn't the differentiator. The ensemble engineering is.
Who feels this most
Directors of marketing analytics, revenue science, and brand insights at consumer-facing companies tend to feel this gap most acutely. They're being asked by their CFO or CMO to put brand investment in the same dashboard as price and distribution, and the toolkit they inherited was never built for that question.
If this framing resonates with what you're seeing in your own numbers, I'd welcome a conversation. The live brand affinity view makes the competitive signal visible quickly: which brands in the set are gaining ground this week, which are losing it, and where sentiment, mindshare, and viral ratio are moving across the field. The competitive read most teams wait a quarter for, on one screen.
Ayşe Akçura is CEO and Co-Founder of eBrandValue. Carnegie Mellon Tepper MBA and MS in Financial Engineering. Previously Vice President at Goldman Sachs and Managing Director at Bear Stearns and Citibank.
Disclosure: I co-led the research described above and lead the company that built it.
To learn more about eBrandValue Platform, and how such metrics influence brand value, contact us using the form below.