
As an example, we analyze the conversations that are affiliated with the soft drink brands and categories. A categorical distribution of the “Ramadan” engagements in the sector is given below for Turkey, a country straddled between Europe and Asia, representing both western and eastern cultures. The analysis includes all social media (Twitter, Youtube, Facebook, Instagram, blogs, etc.) with Ramadan associated engagements. Some conversations include only generic product categories. eBrandValue calls these “the primary data.” For example, breaking fast with tea is the best ( “orucu çayla açmak gibisi yok”) here corresponds to the “Hot Tea” category but will not be included in the selective data level. When conversations include brand assets, these brand-related conversations are included in the selective data. Brand assets may include brand name, proxy uses such as hashtags, specific campaigns, websites, etc. The engagements are filtered with either a primary or a selective keyword, or a recognized related text/object in the shared picture.
Both primary and selective data become important when analyzing category-level and brand-level competition. Figure 1 provides an analysis. There are 8 soft-drink categories. In 2021, for the analyzed period, the most engagement with different authors is generated by Hot Coffee. 44% of active related content producing authors engaged with the category. See the left, outer circle in Figure 1.
A year-over-year analysis is meaningful to understand how the world is changing. For example, Covid and many macro-level trends may have significant impacts on consumer needs and the related conversations. In 2020, the corresponding figure for Hot Coffee was 16%. In contrast to 2021, the most engagement was created with Hot Tea in 2020, with 24% of authors. See the inner circle in the left in Figure 1.
Figure 1 also provides a breakdown of selective level data that only have the brand-specific engagements and exclude the generic categorical data. The conversations reveal that there are 415 soft drink brands creating engagements with the authors in 2021. Figure 1 provides the top 5 most engaged brands in 2021, see the histogram to the right of the figure. The selective-level analysis reveals significant differences. Approximately, 1 every 5 author engagements include brand-level assets, 350K authors in the selective versus 1.6MM authors in the primary. What is more, a third of brand-specific engagements include Coca Cola, although, from a category point of view, the Cola category represents 4% of author engagements.
Figure 1: Ramadan Related Primary-Level and Selective-Level Conversations for Soft Drinks. The Percentages Include Percent of Authors Engaging With The Relevant Category (Primary) or Brand (Selective).
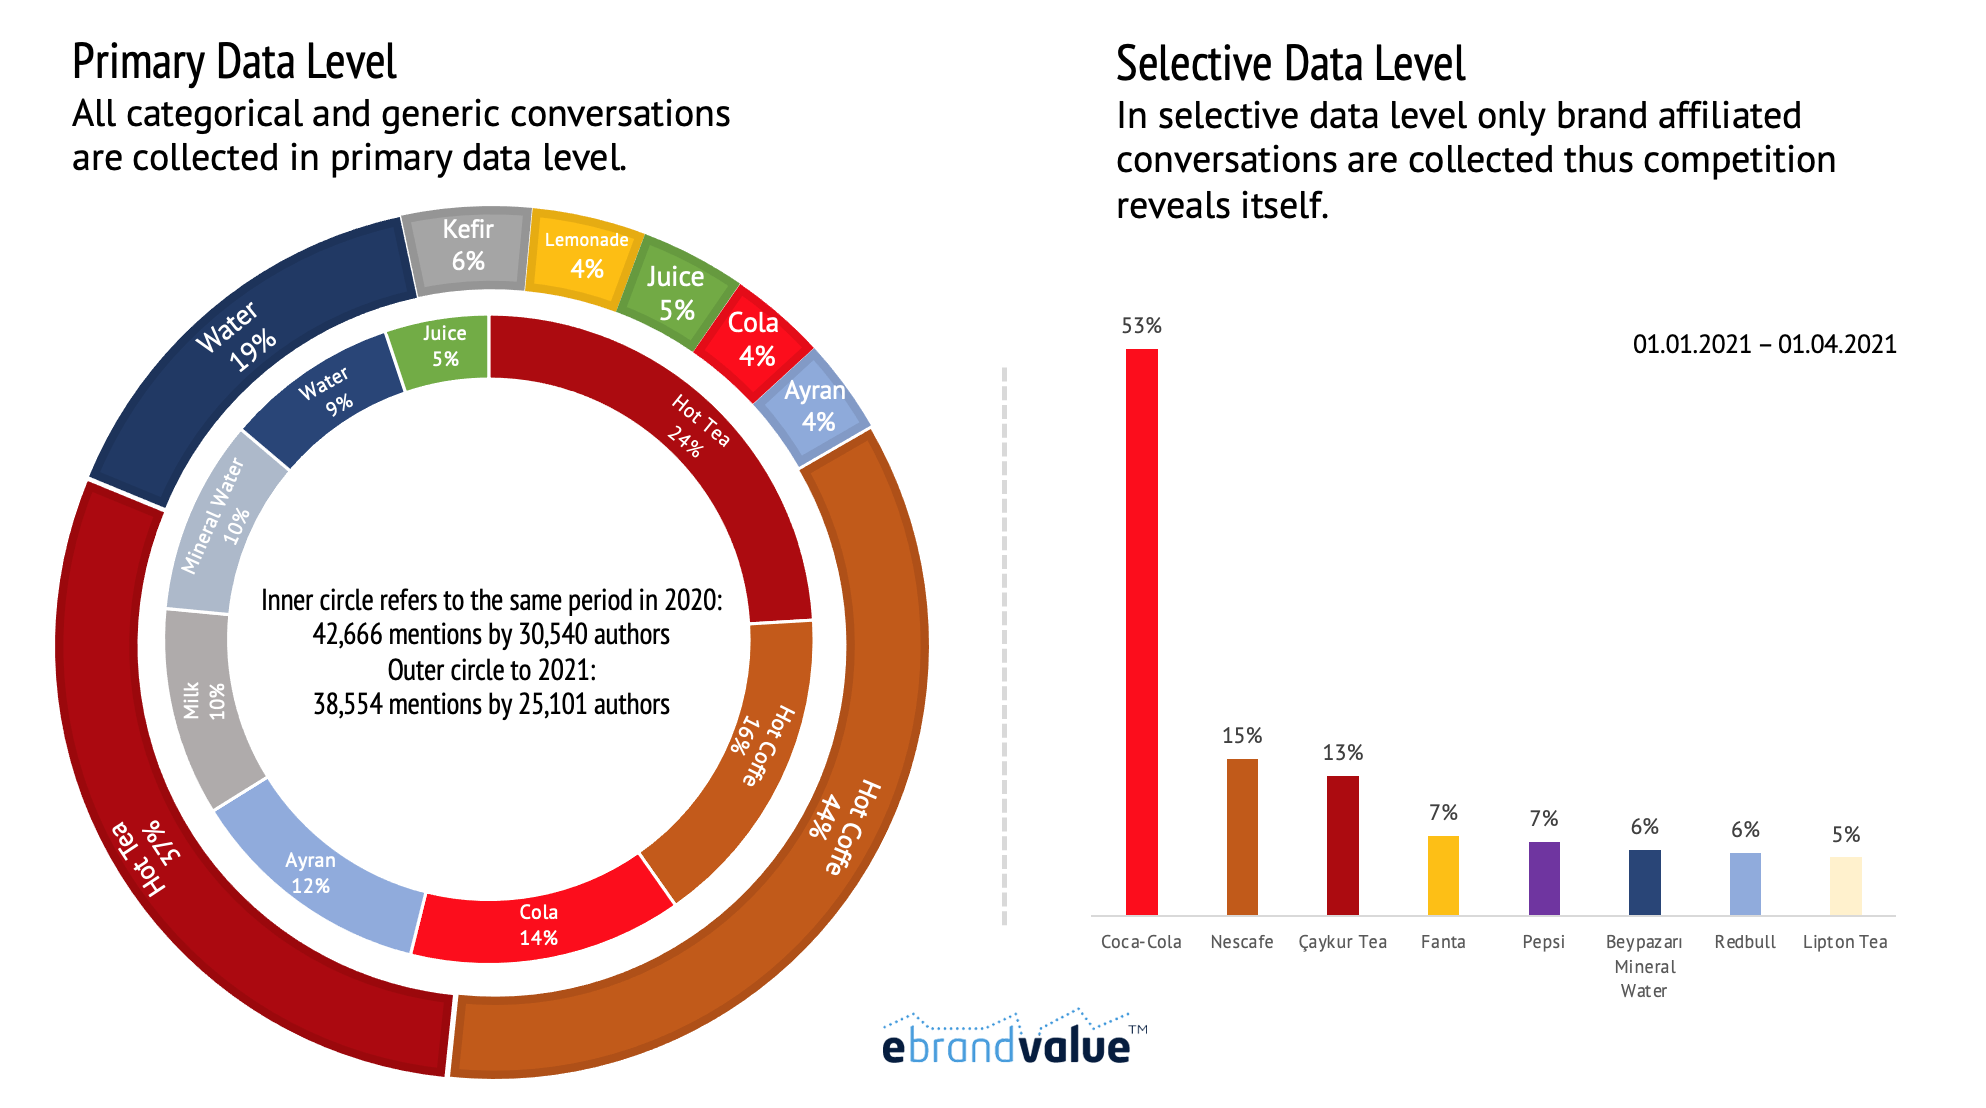
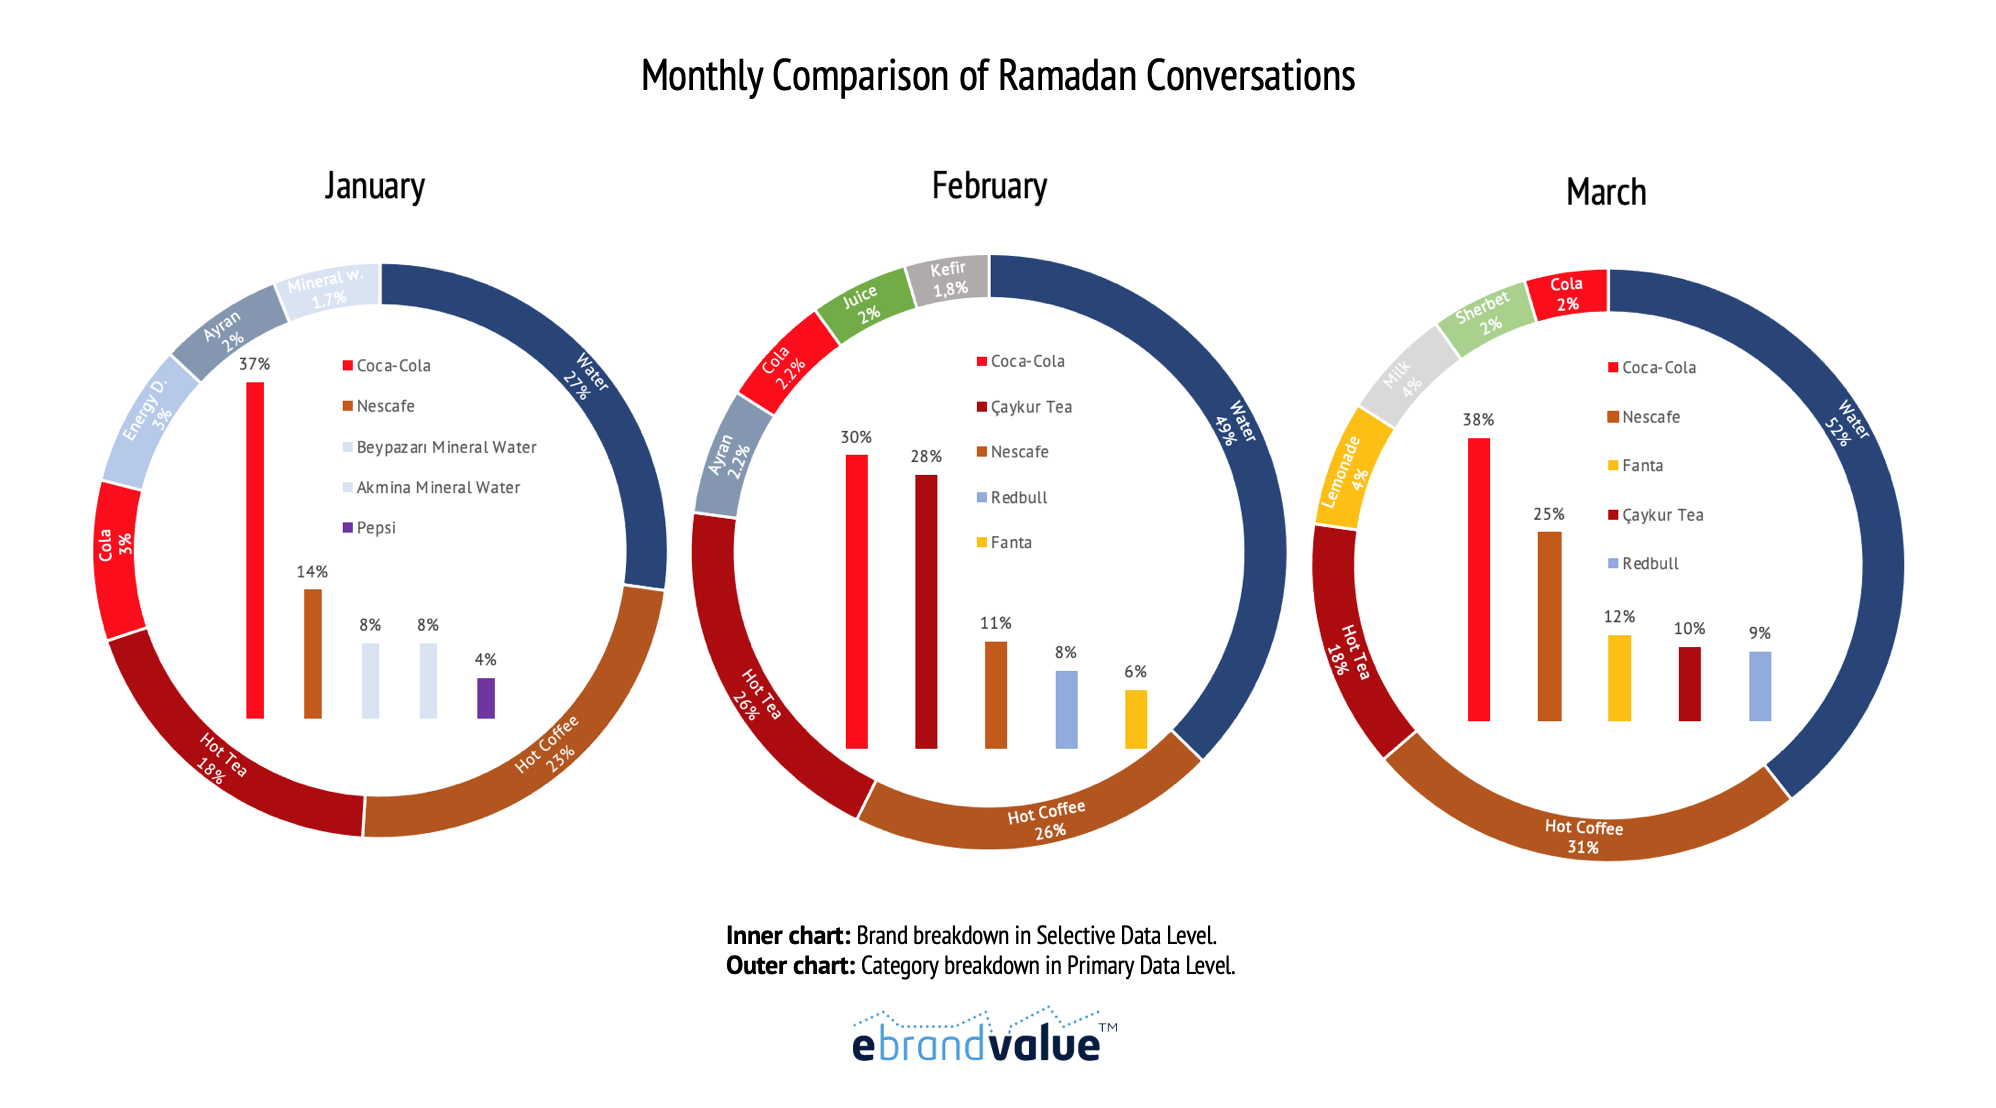
Figure 2 shows that, in the primary-level, water category gains a higher engagement as time nears to Ramadan. Water represents 27% of engagements in January, 49% in February and 52 % in March. Hot coffee follows water closely. See the brown color in the circles in Figure 2.
Hot Tea category engagements do not show a consistent behavior. There is a jump in engagements between January and February, from 18% to 26%. The engagement levels fall back to 18% in March. A deeper look to further understand the motivations is warranted for Hot Tea's engagement spikes. Similarly, an in-depth analysis of water and coffee related engagements may provide hints for superior communications for brands during Ramadan.
When one looks at the brand-specific discussions in Figure 2, Coca Cola has a dominant engagement in the sector, see the inner histograms inside the respective circles and months. Nescafe, Mineral Water brands, a local Tea brand (Çaykur), Redbull, Pepsi and Fanta can be seen in the top-five list across different months. The brands' dominance changes, sometimes, in line with the category salience (i.e., Tea). Counter moves against the category can also be detected, for example, for the case of mineral water brands.
Figure 2: Ramadan Related Engagements for Soft Drink Generic Categories (Primary) and Brands (Selective).
Following primary demand is possible with Brand Affinity gains and losses and real-time traffic light indicators. A green light indicates a healthy and growing category. A brand in a healthy category should benefit from positive category growth. This can be seen from the eBrandValue dashboard as in Figure 3.
Figure 3: Traffic Light Indicators Enable Controlling For Categories’ Relative Growths, Green Light Represents Above Average Growth, Yellow Light, Below Average.

Creating meaningful contexts that capture category-level and brand-level competition is essential in understanding the consumer insights and motivations. eBrandValue allows marketers to see which of the brands or macro market trends contribute the most to the categorical growth.
Event creation feature is useful to focus on a specific topic or an upcoming event, both at the Primary (generic product category) and Selective (brand) data level. Furthermore, with the event feature, eBrandValue reveals the brand position in a specific topic within the Target Market. For example, relative salience of one brand over another can be uncovered and tracked with meaningful (sales-impacting) metrics within the need-based segments or topics in the industry.
eBrandValue’s ID-based tracking grants an opportunity to analyze customer switches both at categorical and brand level. Such an approach provides a much-needed alternative to traditional consumption panels and household diaries, which are lagging indicators at best. The experience shows that eBrandValue’s brand affinity change metrics provide leading indicators to market share gains
eBrandValue’s category/brand-oriented infrastructure, and brand-affinity based ID-level algorithms enable calculation of meaningful metrics which lead to brand positioning, health and sales impact analysis. After reducing the noise accumulated throughout the vast amount of data collected from online media, estimating brands' sales in advance becomes more accurate.This further enables calculation of sales elasticities of brand-specific KPIs, brand health and scorecards.There are many use cases and examples provided in numerous whitepapers and blogs.
eBrandValue Platform'u hakkında daha fazla bilgi edinmek ve hangi metriklerin marka değerini nasıl etkilediğini öğrenmek için aşağıdaki formu kullanarak bize ulaşabilirsiniz.