Technology plays an undeniably critical role during these difficult times. As data scientists, we want to do our part in studying, understanding and defeating this pandemic.
Built on datasets of global confirmed COVID-19 cases (provided by Kaggle) we were able to build a model of the trend that enables us to predict the direction of the pandemic on a country by country basis. Just like the term "viral marketing" is inspired by a pathogen, there are parallels between marketing models and epidemiology. The following analysis was carried out with the use of a diffusion of innovation model, which is used to predict how new products are adopted and spread within a population.
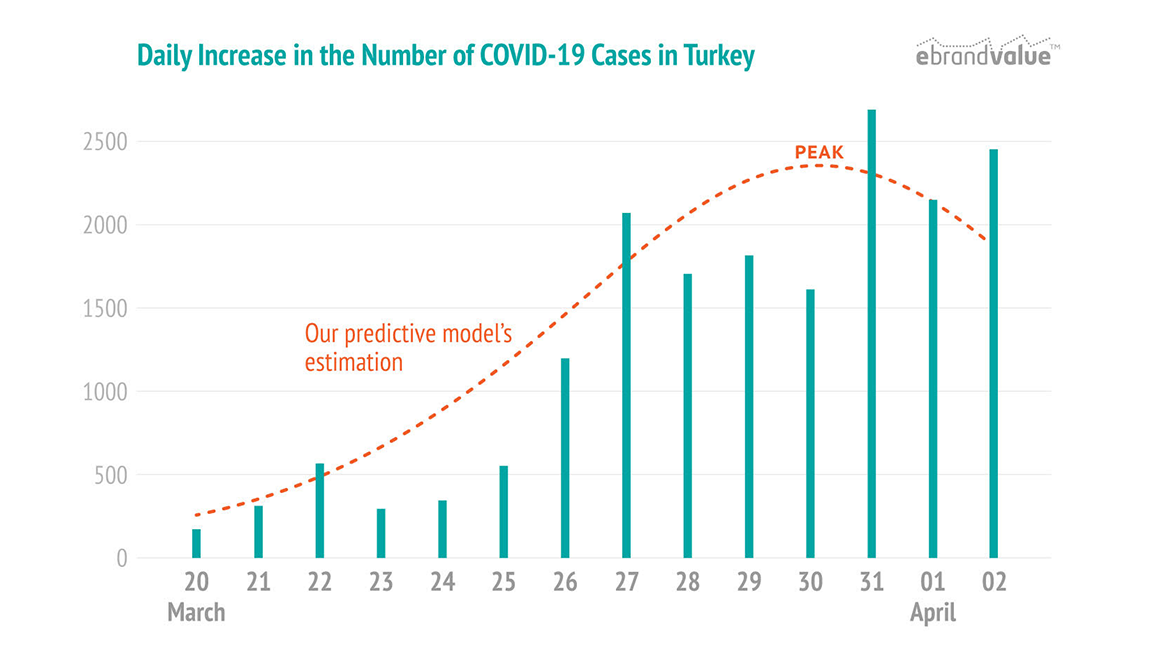
The critical question is, has the rate of infection peaked or is the worst yet to come?
Within the chart, the X-axis shows the progressing date, beginning on the day of an increase of 100 cases. The observed data from the dataset is in blue and shows the number of new positive cases per day. The dotted orange line shows the predictive model’s estimation of the number of new infections per day - an increase in this number indicates an acceleration in the rate of spread.
The model assumes that every infected person can a) spread it to others (parameter q), and simultaneously b) people can continue to catch the virus for unknown reasons at a constant rate (parameter p). The parameters, p and q, are estimated jointly by the model and on that basis, can project if a “peak” of infections was reached or not, and suggest when it will most likely occur.
From what was observed in China, the quarantine can be lifted 15-20 days after a peak has been reached. From the chart, we can see that Turkey’s “peak” infection point was reached at the end of March. Therefore, we can hope that the quarantine will be relaxed during the second half of April. The data includes the latest test results on April 2nd.*
* The model confidence interval suggests that there may be as much as 15 times more than the reported cases in Turkey, bringing the total infected to date to 250K. Still, the timing of the peak is pretty robust.

DISCLAIMER: This model and its results are dependent on the accuracy of the provided data. Changes and updates to the data will impact these predictions. While these tools have undergone rigorous review to ensure their reliability, these results are still a prediction and should therefore not be taken as absolute. We will continue to update this projection on a weekly basis. Please also note that the analysis is carried out using test-positive data rather than the death numbers for two reasons: (1) test-positive is a leading indicator by 15-20 days, (2) the daily increments of test-positives are expected to increase as test numbers increase. Still, seeing a "peak" shows that directionality in virus spreading rate is leveling off. This creates a positive bias for the results.
eBrandValue Platform'u hakkında daha fazla bilgi edinmek ve hangi metriklerin marka değerini nasıl etkilediğini öğrenmek için aşağıdaki formu kullanarak bize ulaşabilirsiniz.