How service failures turn into customers moving to competitors, and why the first signs appear weeks before the quarterly numbers.
A customer who has waited three weeks for an answer about an insurance claim rarely announces that they are leaving. The next post is more likely to mention a quote from a competitor.
Brand switching is the movement of customers from one brand to another within the same category. Service failures are among its documented causes, and on social media the trail often begins with a complaint that went unanswered. Because those conversations are public and time-stamped, the movement shows up in social data weeks before it reaches renewals, sales or the next brand tracker.
Most brand teams hear about switching later, from a renewal rate, a market share report or a survey wave. Those measures confirm a loss without saying who left, what happened to them first or which competitor they chose. This article traces one such loss back from eBrandValue's switching data to the care queue where it started, and to Connect by eBrandValue, the sister product built for the team that works that queue.
How customer service failures turn into brand switching
The trail starts with a choice the customer makes. One who leaves without complaining gives the brand nothing to work with. One who complains on a public channel gives it a chance to fix the problem while other customers watch, and the reply, or the lack of one, in the next few days often decides whether that customer stays.
When no reply comes, the same person tends to post again. Then they ask followers to recommend a better provider, mention a competitor's offer and, some weeks later, talk about that competitor as their own brand. Each post on its own looks like customer service traffic. Read in order, for one person, the posts describe a switch.
A renewal season at an insurer
The pattern is easiest to see when complaints arrive all at once, as they do in the example below. The insurer and the people in it are fictional.
In late May, a hailstorm damages cars and roofs across one region. Claims at a mid-sized home and motor insurer jump within days, and the claims team falls behind. Customers who cannot reach an adjuster turn to public channels: replies under the insurer's Instagram posts, mentions on X, one-star reviews of the claims app.
Hugo, who leads customer care, has a social team staffed for an ordinary month. It answers in the order messages arrive. Posts about a specific claim get a standard line asking the customer to send a direct message, and many of those messages then wait for days. Some public complaints are never answered.
None of this shows up in the numbers Renata, the brand director, reads. The quarterly brand tracker was in the field before the storm, awareness and consideration are stable, and new policy sales are on plan.
The first sign reaches her in mid-July from Tess, the insights analyst. In the brand switching view, outgoers, people who used to talk about the insurer as their own brand and now talk about another, have risen well above the usual monthly level, and most of them went to the same competitor. When Tess reads what those authors posted earlier, many wrote about a claim in May or June. Several posted more than once without a reply.
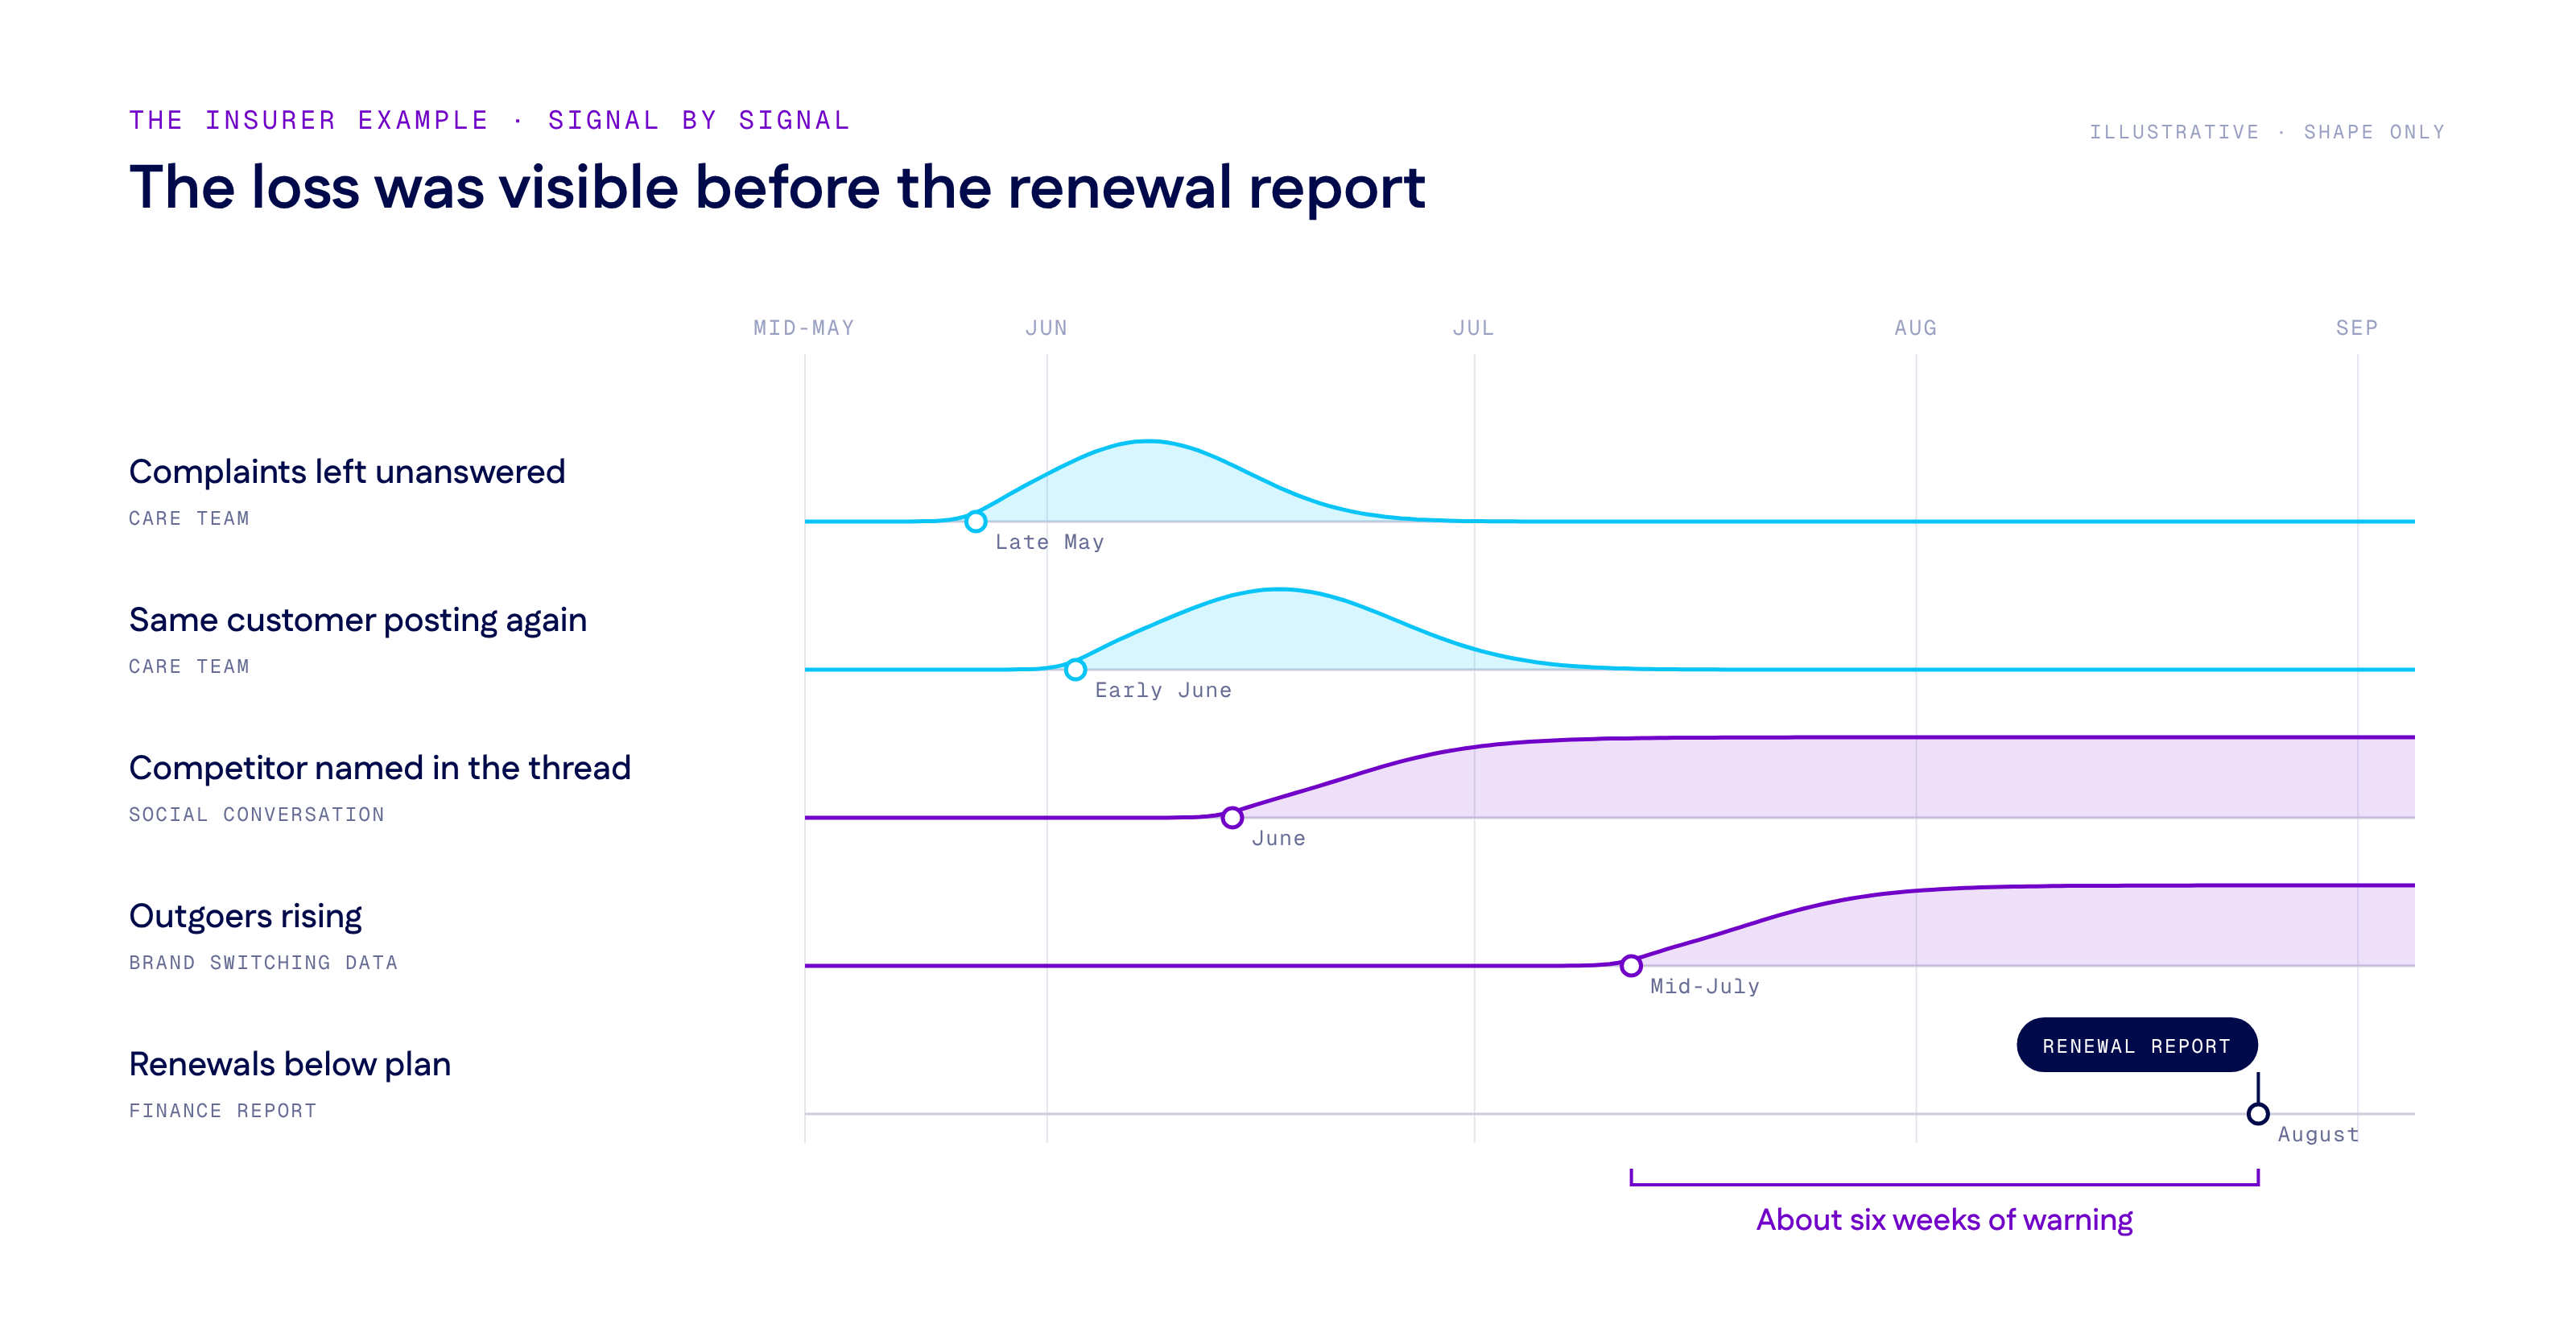
In August, motor renewals in the storm region come in below plan. The renewal report confirms the loss about six weeks after the switching view had shown the people, the reason and the destination.
What switching research says about service
Tess's finding, that the people who left had first complained about claims, fits one of the best-known studies of why service customers switch. In a 1995 study in the Journal of Marketing, Susan Keaveney collected accounts from more than 500 service customers and identified more than 800 behaviors of service firms that caused them to switch, grouped into eight categories. Most of the causes in the study are things the firm did, not traits of the customer who left, and so within its control.
The impact of customer service on brand loyalty, measured in people
Acting on a cause the firm controls means knowing which customers it cost. Brand loyalty is often reported as an attitude score, while switching analysis treats it as behavior with a direction: who arrives, who stays, who leaves and where they go. The difference between brand equity and brand affinity rests on the same idea: affinity is one person's preference, and summed across many people it becomes a view of equity that can be tied to sales.
eBrandValue classifies the people talking about a category as newcomers, incomers, existing authors and outgoers, at the level of individual authors rather than mention volume. It has measured brand switching on social media this way for more than a decade, and its model of who comes, who leaves and who stays, "A Model of Brand Health," is the subject of a patent application allowed by the USPTO in 2026.
At the insurer, three readings of the outgoers mattered more than their total. What they had posted before leaving was about claims, not price. Where they went was mostly one competitor. And the switch usually came weeks after the first unanswered complaint, which marks the window in which a reply could still have changed the outcome.
Customer churn signals that appear before the quarter closes
That window is visible only if the signals are read in order. In subscription businesses, churn signals usually come from product usage and billing. For brands whose customers talk in public, the earliest ones come from conversations, and at the insurer they arrived in this sequence.
| Signal | Where it appears | In the insurer example |
|---|---|---|
| Complaints left unanswered | Care team's channels | Late May |
| The same customer posting again | Care team's channels | Late May to early June |
| A competitor named in the thread | Social conversation | June |
| Outgoers rising, with a destination | Brand switching data | Mid-July |
| Renewals below plan | Finance and sales reports | August |
The care team saw the first two rows, the brand and insights team the middle two, and finance the last. The third row can reach the brand team sooner. Care teams can capture these competitor mentions as they arrive, as described in how a care team tracks competitor mentions with a label, a keyword rule and a weekly summary. The argument for measuring brands daily rather than once a quarter is laid out in brand metrics that show up before the quarter closes.
Who leaves, and for which competitor
Only the fourth row names a destination, and the headline numbers tend to bury it. Mindshare, a brand's share of the people talking about its category on social media, shows the net effect. A brand can hold it steady while losing loyal customers to one competitor and gaining new ones elsewhere. At the insurer the net figure barely moved, because newcomers from elsewhere offset the outgoers.
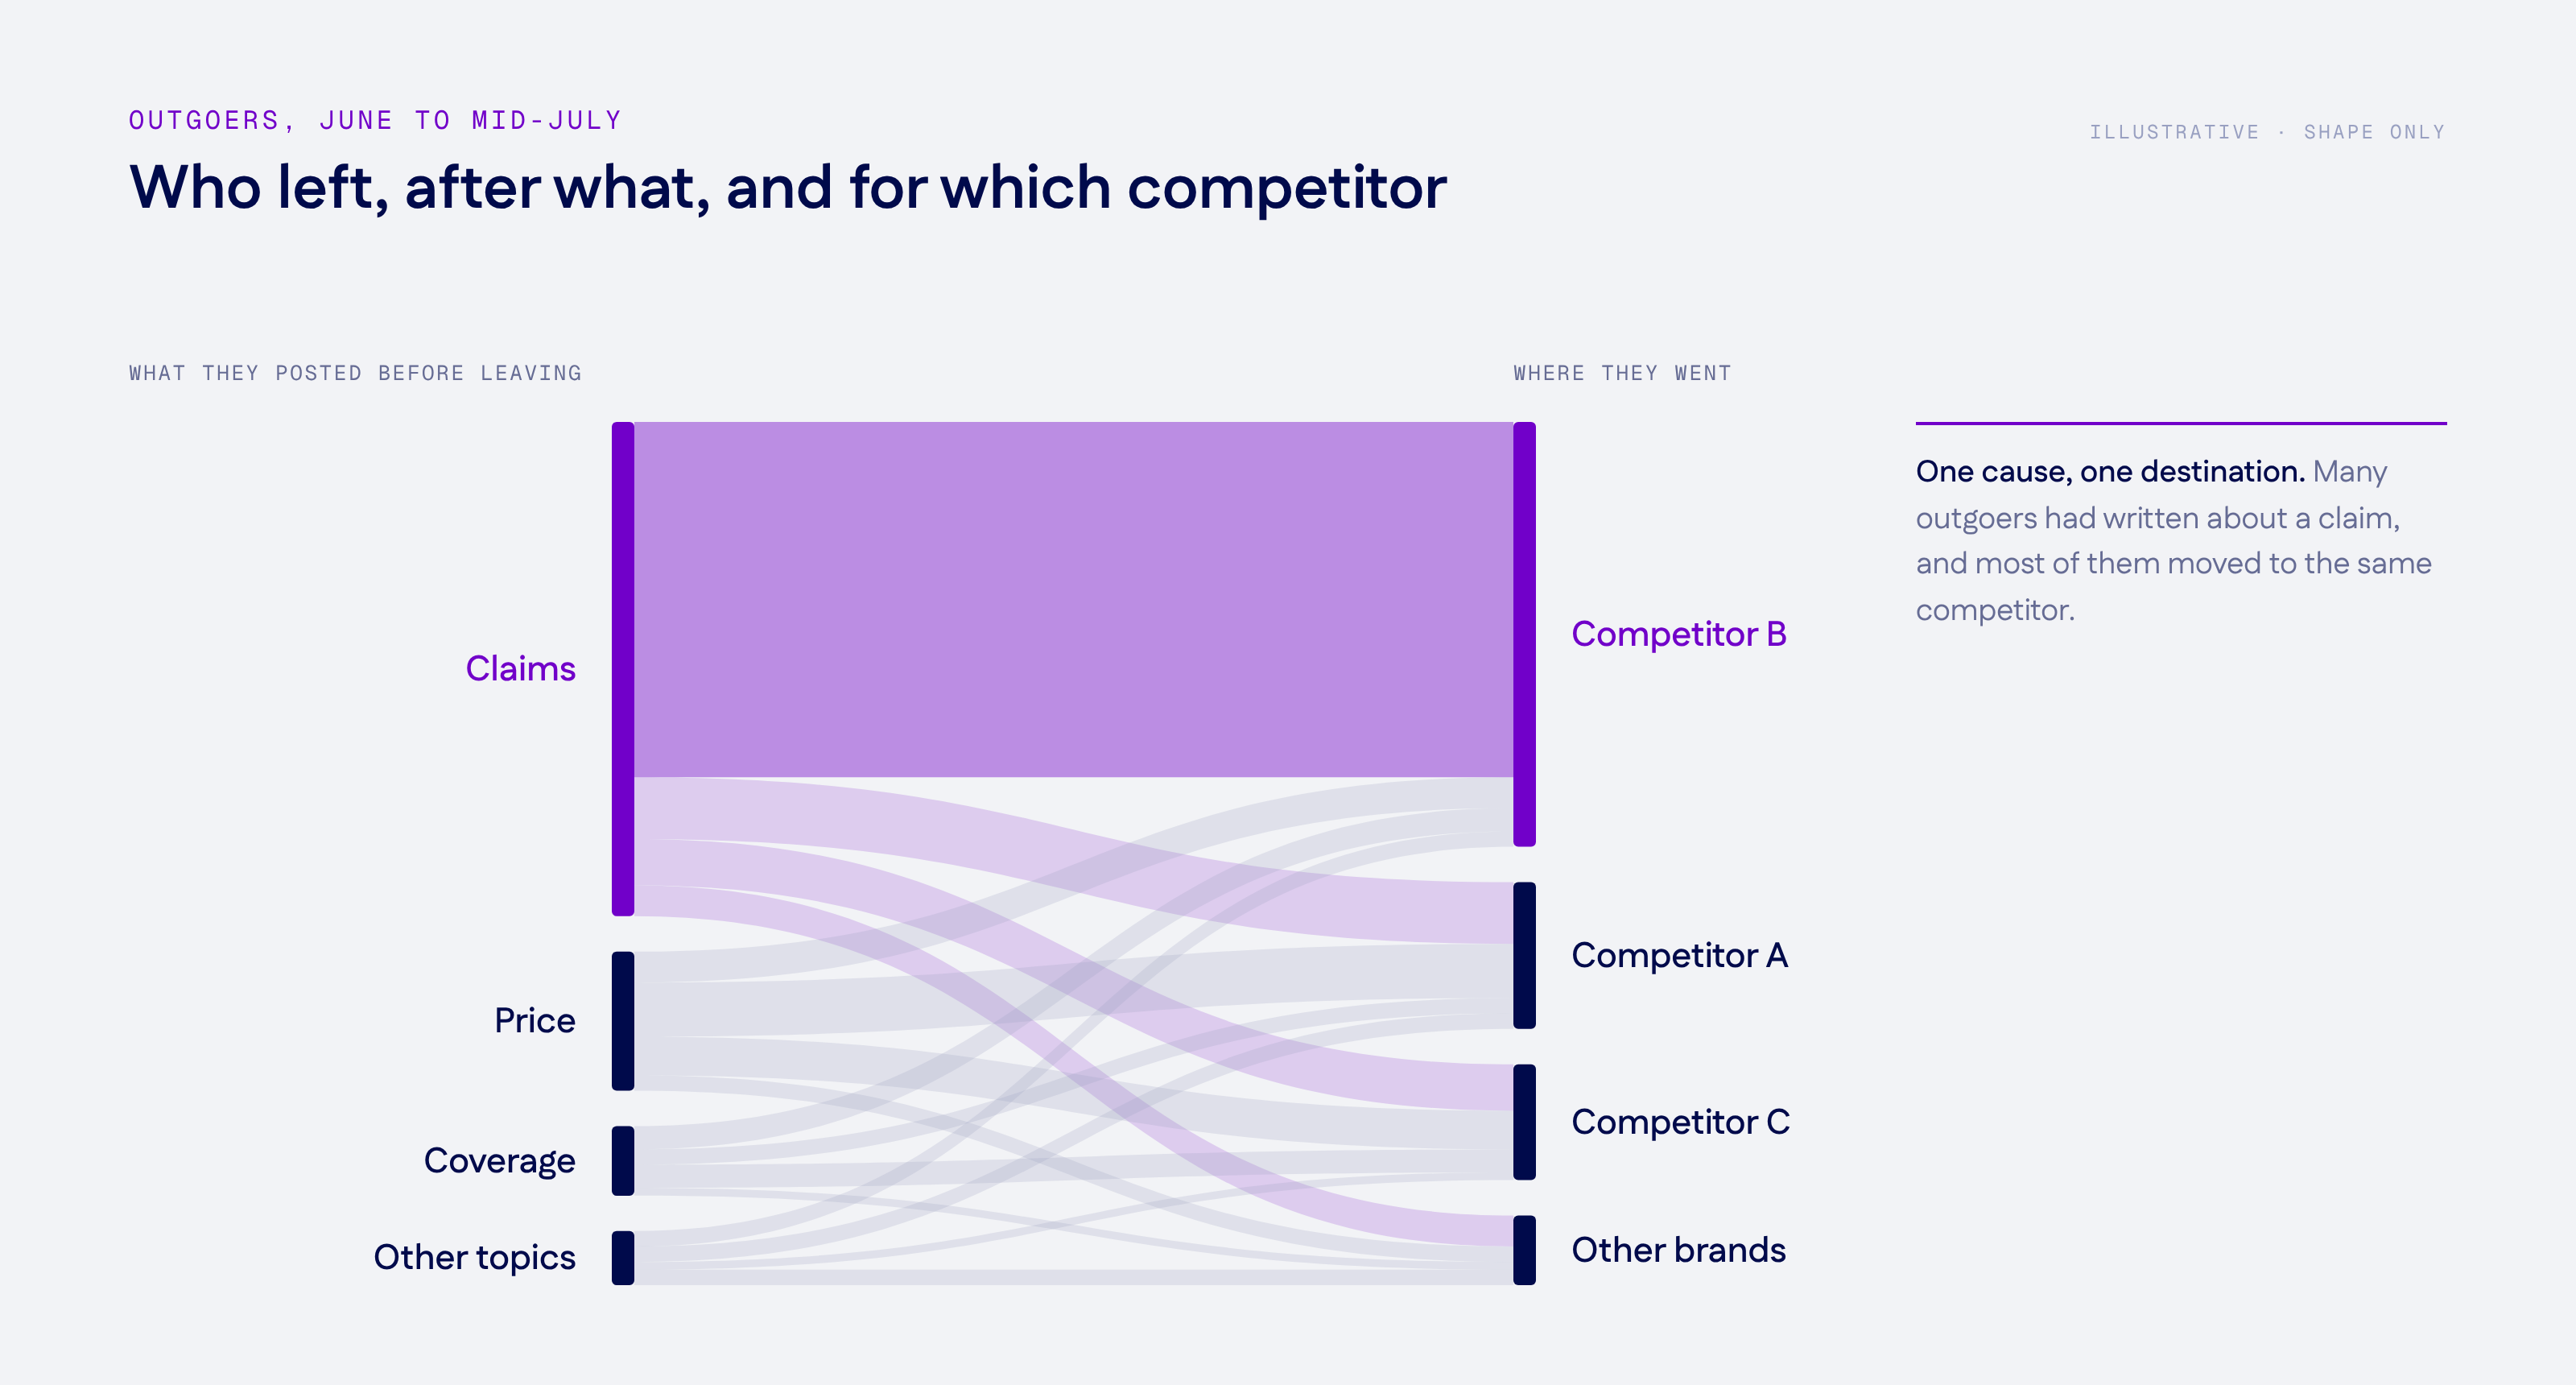
The destination tells the brand team what kind of problem it has. Outgoers spread across the category point back to the brand's own service. Outgoers concentrated on one competitor raise a second question: what that competitor offers at the point where the brand failed. Tess found that Competitor B's own customers often mentioned how quickly their claims had been handled. B was winning on claims speed, not on price. The broader method is covered in this introduction to brand switching analysis.
From the switching view to the care queue: Connect by eBrandValue
Renata's report to the leadership team named the cause and the competitor. A switching view shows what service failures have cost, not which complaints are still waiting that morning, and it cannot answer any of them. The fix sat with Hugo: answer claim complaints in public channels faster, route them to people who can act on a claim and stop sending customers to a direct message queue that nobody watched closely.
That work happens in the care team's tools, not in a brand dashboard. Connect by eBrandValue, the sister product built on eBrandValue's data engine, is a customer experience management platform that brings comments, mentions, direct messages and reviews into one shared inbox. Keyword and volume alerts go to the team that owns the issue, which means a spike in claim complaints reaches the person responsible for claims instead of a shared mailbox. Agents reply with an AI draft that a person reviews before sending.
Response times are reported by channel and topic, so a claims backlog appears on its own line; Connect's post on what a good average response time can hide explains why a single average misses it.
After the next storm, Hugo's team will see which claim complaints are still open on any given day, and Renata will check one number in the switching view: how many of the customers who complained became outgoers.
If your renewals or sales have slipped and you want to know who left, why and for which competitor, ask us for a brand switching demo. If the answer leads back to your care queue, as it did for the insurer, the product tour shows how Connect by eBrandValue brings every channel into one care inbox.
Frequently asked questions
What is brand switching?
Brand switching is when a customer moves from one brand to another within the same category, for example from one insurer or one beer to a competitor. Analysis of brand switching looks at who moves, in which direction and to which competitor, rather than only at the total number of customers gained or lost.
What causes customers to switch brands?
Common causes include price, product quality, convenience and service. Research on service industries, including Keaveney's 1995 study in the Journal of Marketing, traces many switches to specific behaviors of the service firm, which means many of them can be prevented.
How does customer service affect brand loyalty?
A complaint gives the brand a chance to keep a customer who is already considering alternatives. When the complaint goes unanswered or is handled badly, the same customer may name a competitor in later posts and move within weeks, which shows up as brand switching before it appears in sales or renewals.
How can you spot brand switching before it shows in sales?
Track people rather than mention volume. Classify the authors in a category by whether they arrive, stay or leave, note which competitor the leavers move to and read what they posted before the switch. Unanswered complaints, repeat posts and competitor mentions can appear weeks before the quarterly results.
To learn more about eBrandValue Platform, and how such metrics influence brand value, contact us using the form below.