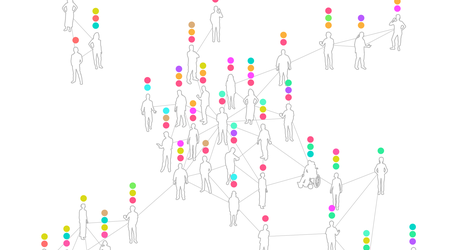
With the new Network analysis developed by eBrandValue, companies can easily see the followers and interactions of social media users who talk about a certain topic (for example, an event) ,they can also easily see large groups of users who are connected with each other. This creates a detailed network map where the big picture can be seen at a glance.
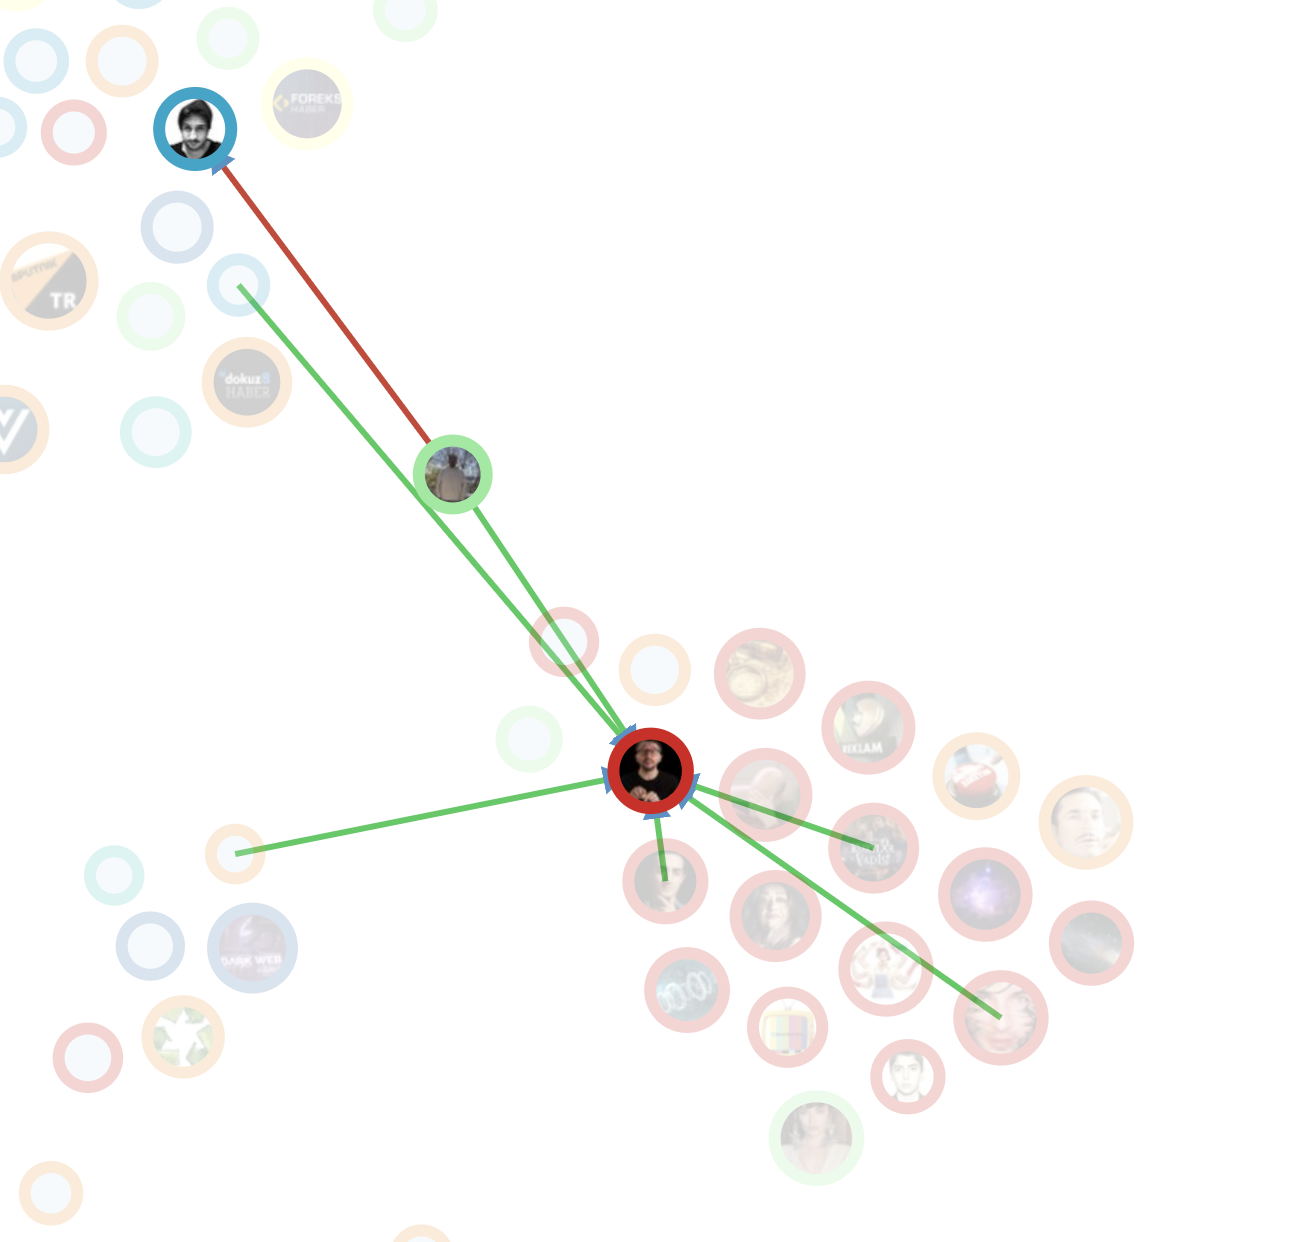
Small bubbles appear that show the ID’s in the relevant social network. ID’s interacting with each other (for example, following) stand closer to each other in the live diagram, and when looking at the big picture, the communities formed by different groups, ID’s outside these communities and ID’s who have the potential to combine these communities can be seen on the network analysis page. eBrandValue subscribers can also examine the people who have the potential to unite the communities in more detail by hovering over the relevant bubble. When clicking on the relevant bubble, more detailed information about the content and its mindshare can be seen.
While analyzing a specific event or a post, related comments are categorized as Early Engagement/ Late Engagement.
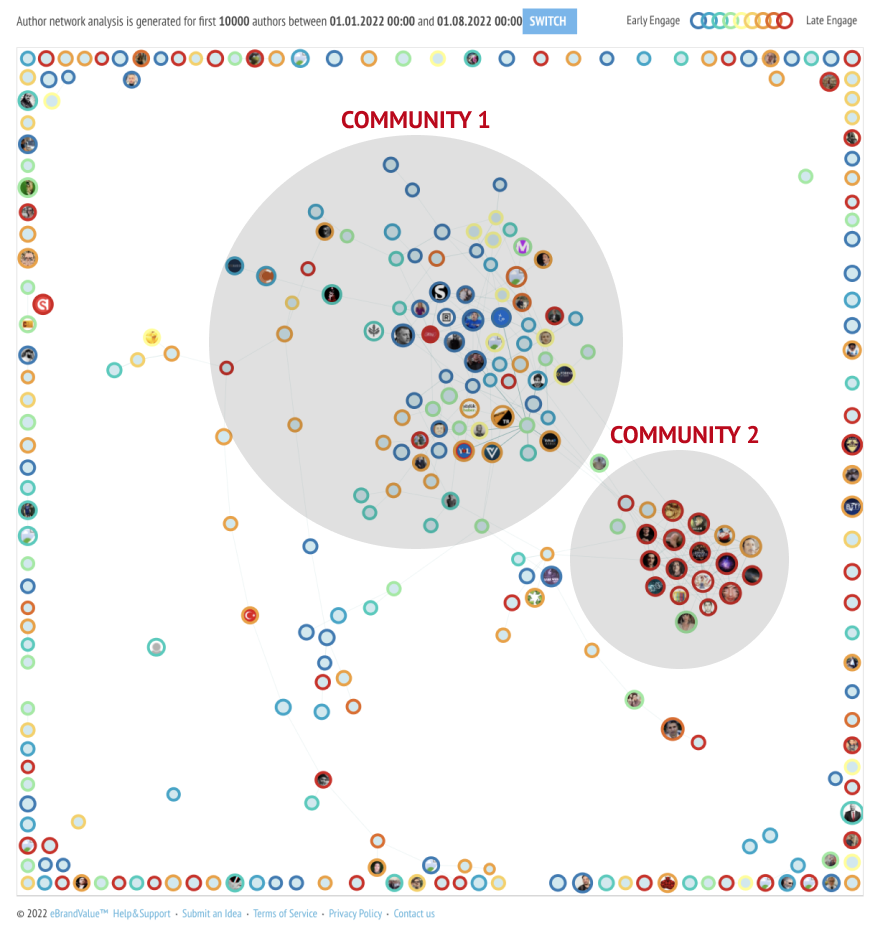
To give an example, according to the network analysis of X brand beer, a total of 13,531 content was produced by 7.567 people between 01.01.2022 and 01.08.2022. The interactions of these users enable them to stay closer in the network diagram. Looking at the related network diagram, it is possible to see two different communities in terms of density. The community in the middle is mostly “Early Engagers” and the community on the right is “Late Engagers”.
Looking at the posts in Community 1, it is seen that there is a lot of talk about football. Football may increase the interaction of people here, and these people may discuss different topics of football and bring many different interpretations. Moreover, since these users are close to each other (they have common followers or following common people), they are more likely to talk about the same topics in general. Because they often come across similar content.
In the posts in Community 2, there is a common negative attitude against some brands in general. These users, who generally share very similar content, are more connected and interact with each other than in Community 1. When the two communities are considered together, the content that both sides like in common is generally "emotional" content. For example, an emotional short commercial that will leave a mark in the hearts of customers was appreciated by both sides.

By using network analysis, it is possible to get to know the users and user groups that react to the same brands better, to improve the decision-making processes of the companies, and to increase the value propositions they offer. This development, which enriches the experience of the eBrandvalue subscriber with the visualization of the data, can benefit brands in the creation of different product segments.
To learn more about eBrandValue Platform, and how such metrics influence brand value, contact us using the form below.